
Your complete command center for customer retention
uncvr connects to your CRM, monitors every conversation, surfaces risk before it becomes churn, and drafts the follow-up — so your team can focus on relationships, not spreadsheets.
Your real-time command center
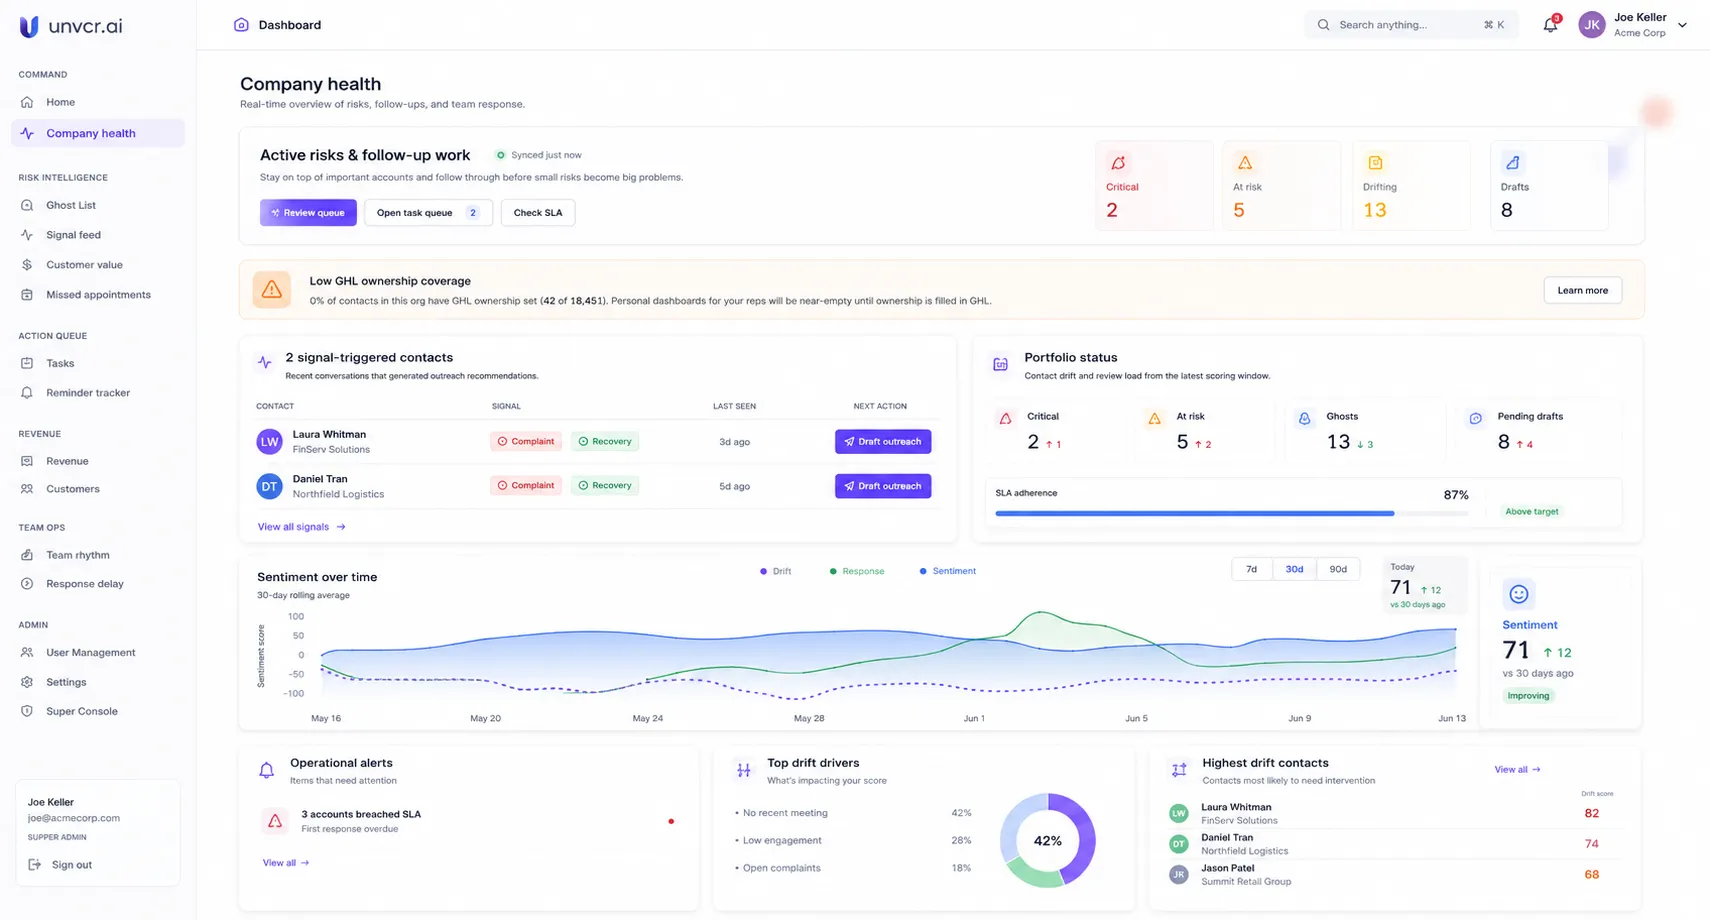
See everything happening across your organization at a glance. The Company Health dashboard surfaces critical contacts, portfolio drift trends, operational alerts, and signal-triggered recommendations — all in one view. Personal dashboards give each rep their own KPIs, coaching moments, and at-risk contacts.
Portfolio status: critical, at-risk, ghosts, and pending drafts
Sentiment over time with 7d / 30d / 90d trends
Operational alerts with SLA risk indicators
Signal-triggered contacts with one-click draft outreach
Per-rep KPI cards and AI coaching moments
Surface risk before it becomes churn
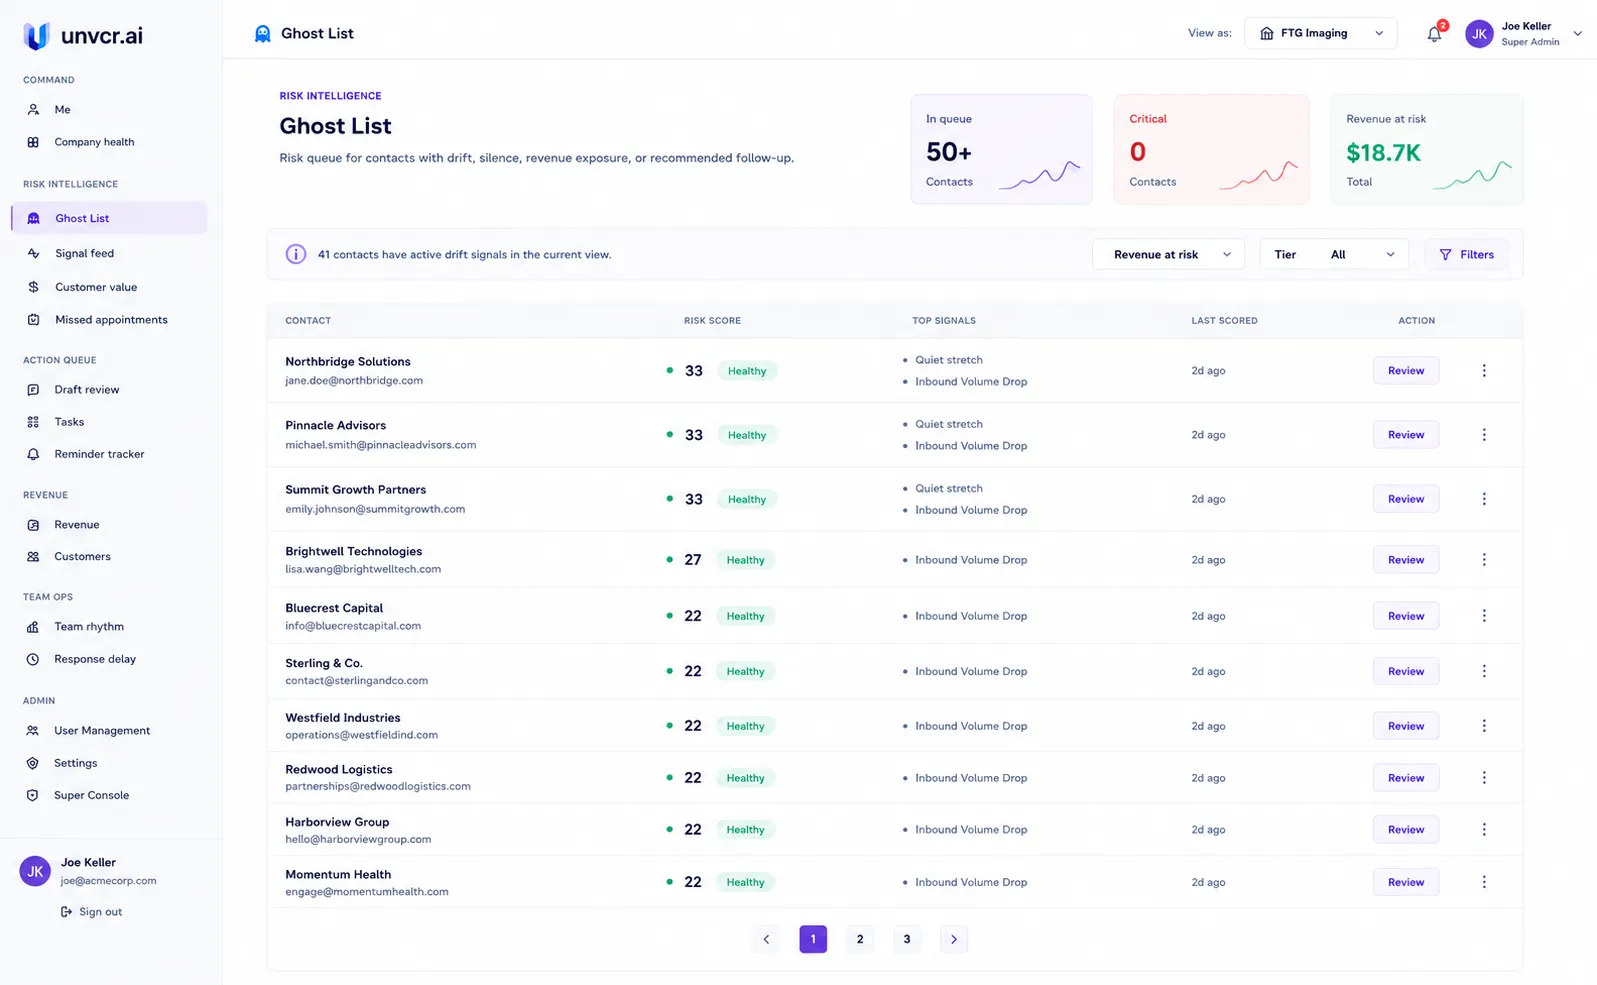
The Ghost List is your prioritized risk queue — contacts showing drift, silence, or revenue exposure ranked by severity. The Signal Feed explains why each contact needs review with sentiment events, revenue signals, and severity badges. Customer Value tracks lifetime revenue, outstanding invoices, and overdue accounts across your portfolio.
Paginated risk queue with tier filters (Critical / Red / Yellow / Green)
Revenue-at-risk totals and overdue invoice amounts inline
One-click AI draft generation per contact
13+ sentiment signal types with severity badges
Lifetime revenue, paying customers, and outstanding amount KPIs
Understand why a contact needs attention
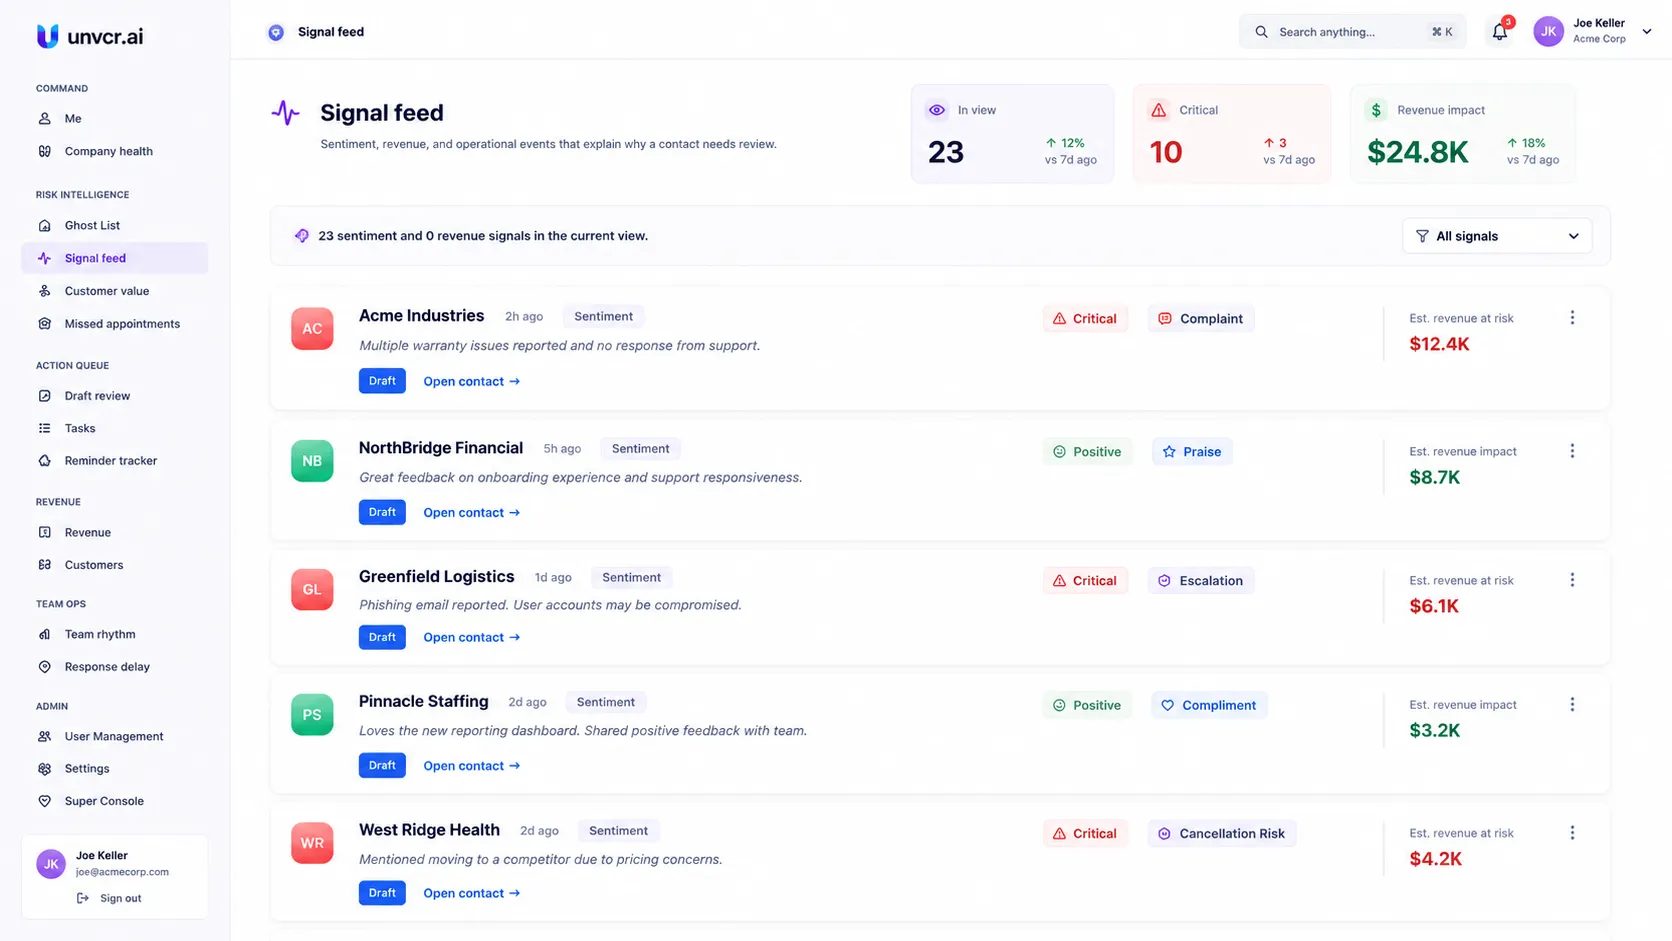
Every signal that fires — cancellation intent, competitor mentions, complaints, overdue invoices — lands in a unified feed. Each event shows severity, revenue impact, and a direct link to draft a follow-up. Filter by category or type to focus on what matters most right now.
Sentiment signals: cancellation intent, frustration, competitor mentions
Revenue signals: overdue invoices, outstanding balances
Severity badges: critical, concerning, watch, positive, info
Per-signal Draft button for instant AI follow-up
Estimated revenue at risk displayed per contact
Revenue intelligence across your portfolio
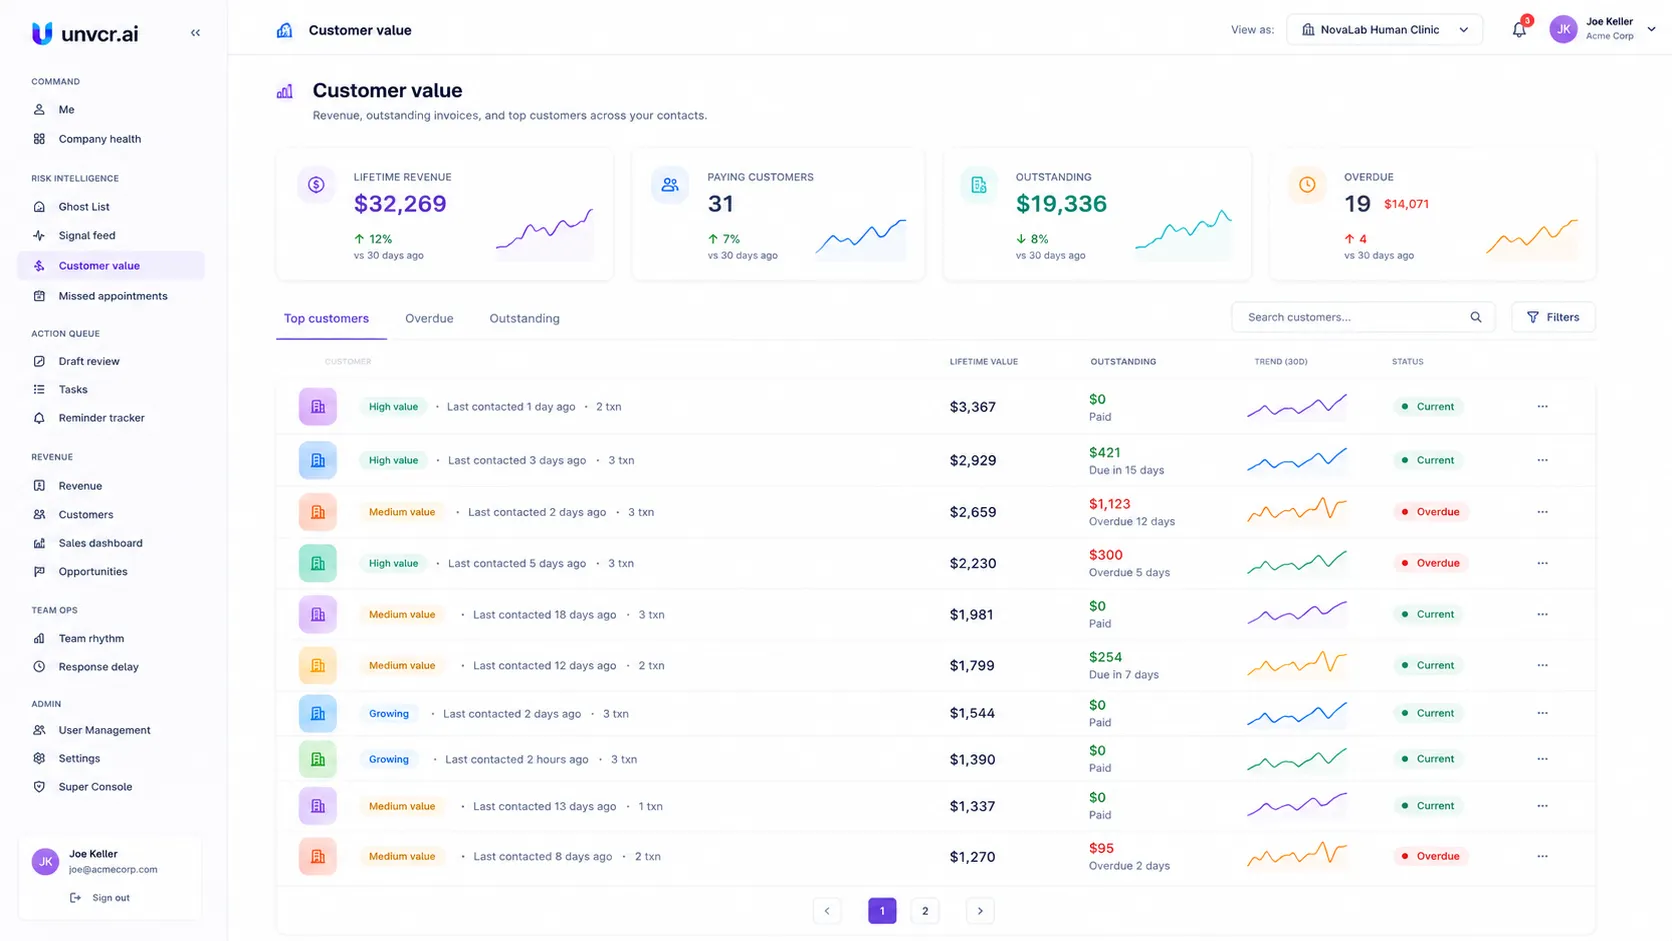
Track lifetime revenue, paying customers, outstanding amounts, and overdue counts in real time. View your top customers by value, filter by overdue or outstanding status, and monitor 30-day spending trends per contact. Tier badges highlight high-value and growing accounts.
Lifetime revenue and paying customer KPIs with 30d trends
Top customers / Overdue / Outstanding tab views
Spending trend sparklines per contact (30-day window)
Tier badges: High value, Medium value, Growing
Overdue status with days overdue and amounts
AI-drafted outreach, human-approved delivery
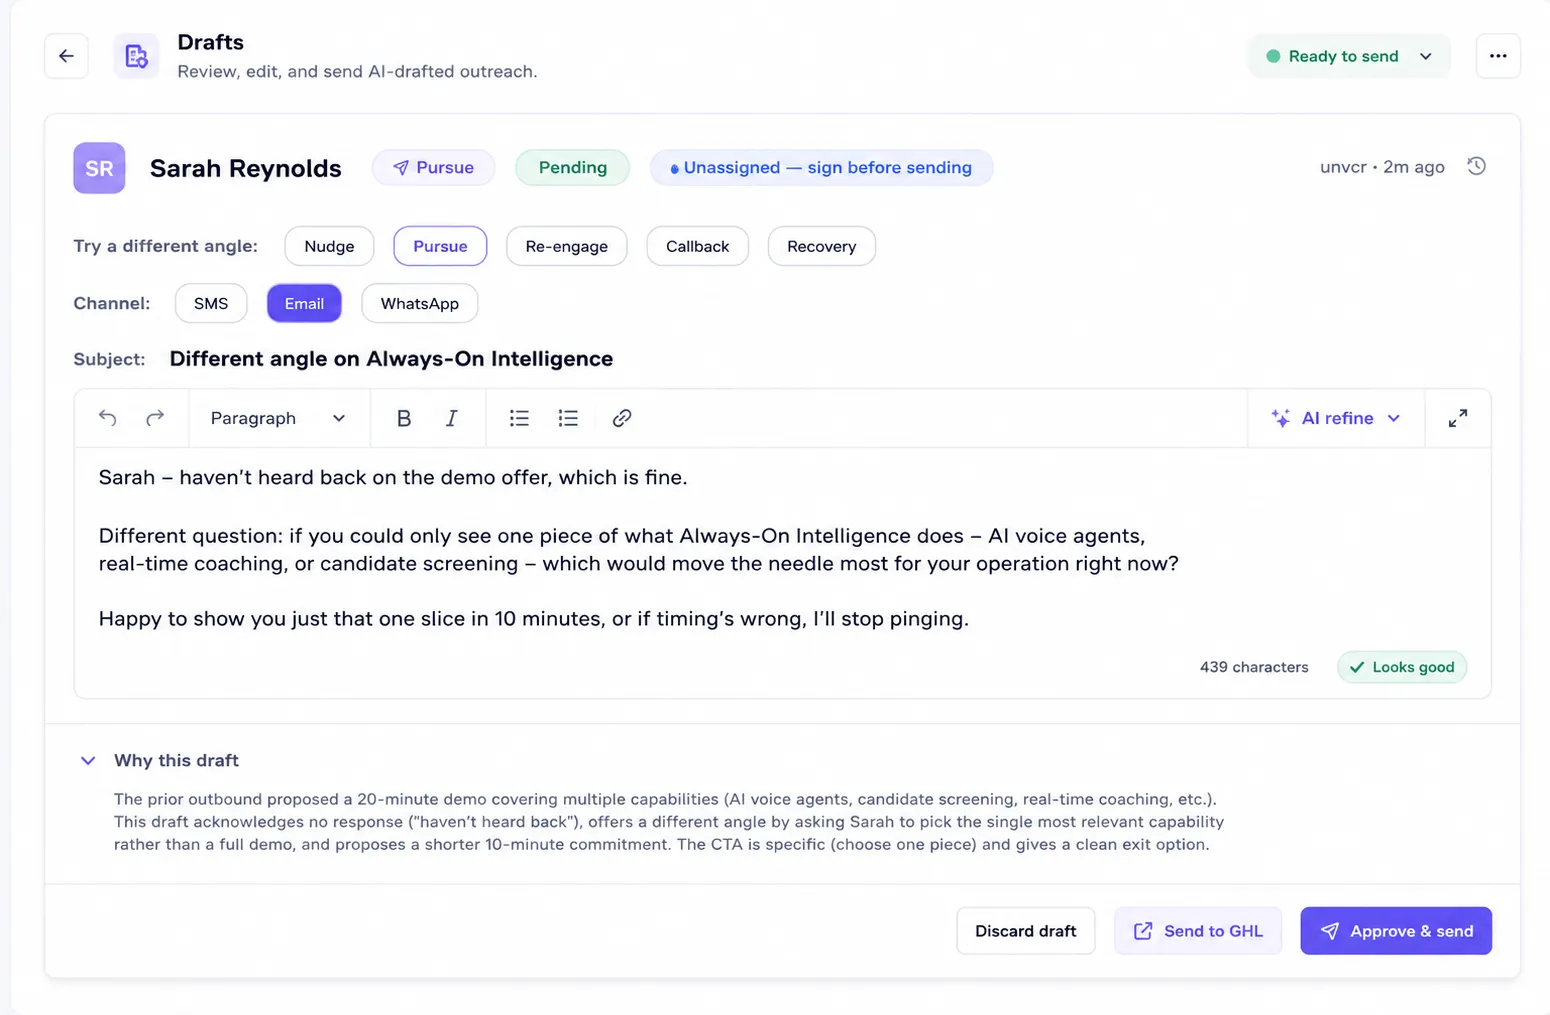
When uncvr detects a contact needs attention, it drafts the message — choosing the right angle (nudge, pursue, re-engage, callback, recovery), channel (SMS, email, WhatsApp), and tone. Your team reviews, edits inline, and approves before anything is sent. Every draft explains why it was written.
Draft types: Nudge, Pursue, Re-engage, Callback, Recovery
Channel selection: SMS, Email, WhatsApp
Inline body editing with AI refine assistance
"Why this draft" reasoning for every generated message
Approve & send, reject, or regenerate with different angle
Sales analytics and pipeline visualization
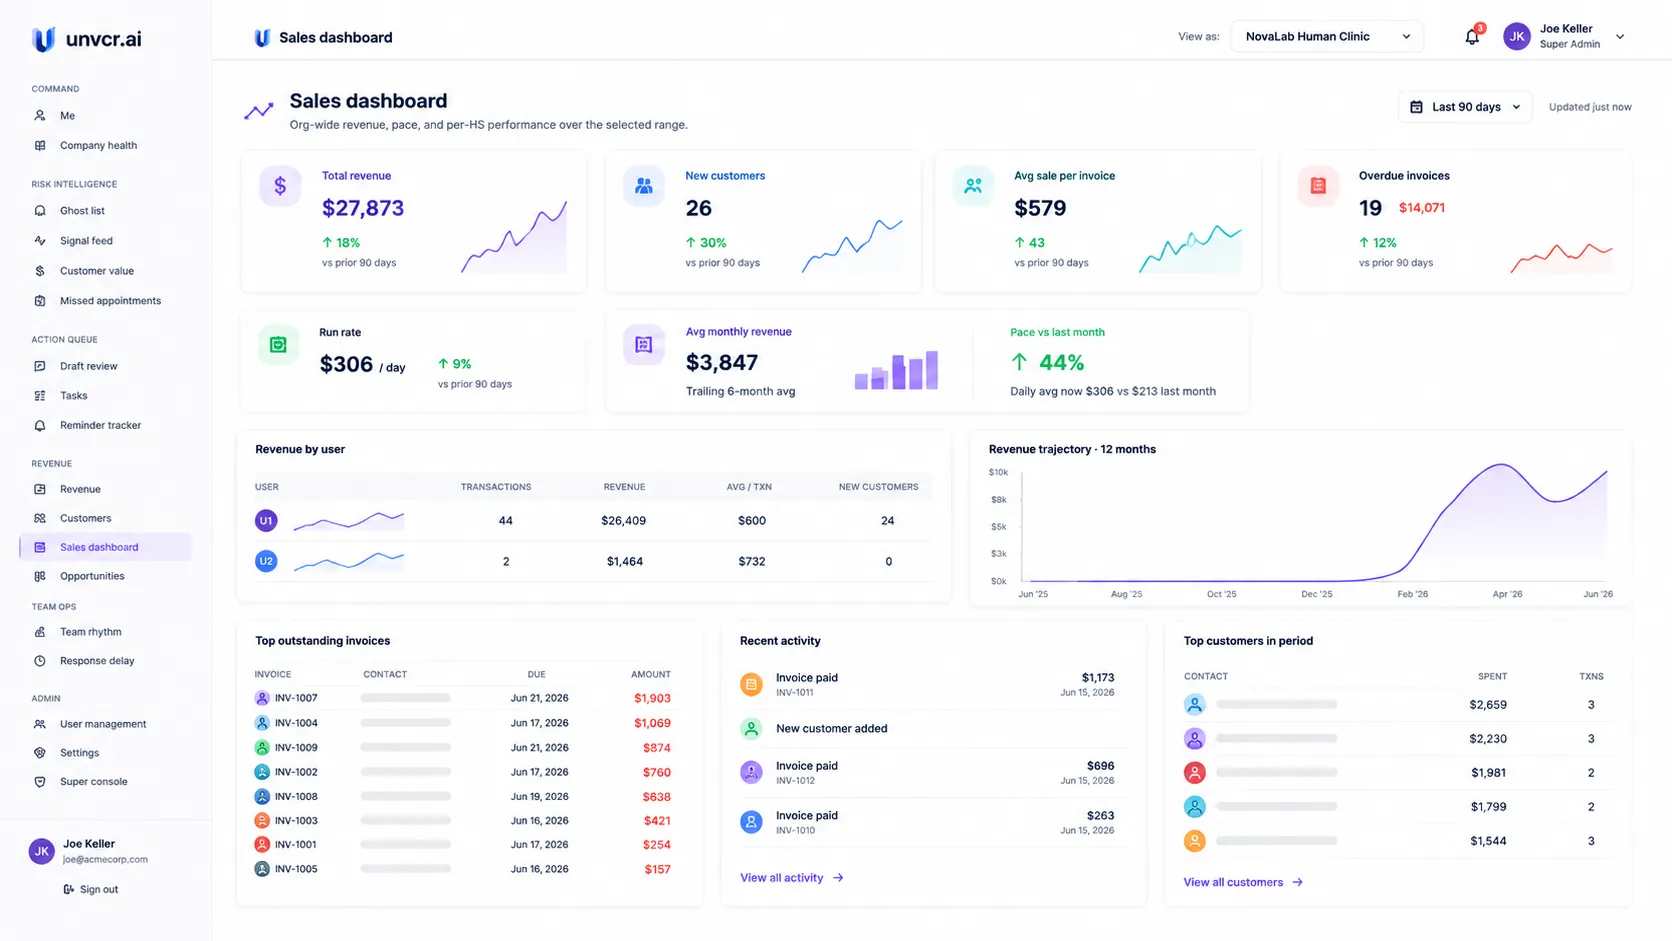
The Sales Dashboard delivers date-range scoped KPIs — total revenue, new customers, average invoice value, conversion rate, and daily pace vs. target. Revenue trajectory charts show 12-month trends. The Opportunities view maps your pipelines as interactive flow graphs with health scoring per stage.
KPI row: revenue, invoices, avg invoice, new customers, conversion rate
Daily pace vs. target with projection for current period
Revenue trajectory chart (12-month trend)
Revenue by user breakdown with transaction counts
Outstanding invoices grid with status and due dates
Pipeline health at every stage
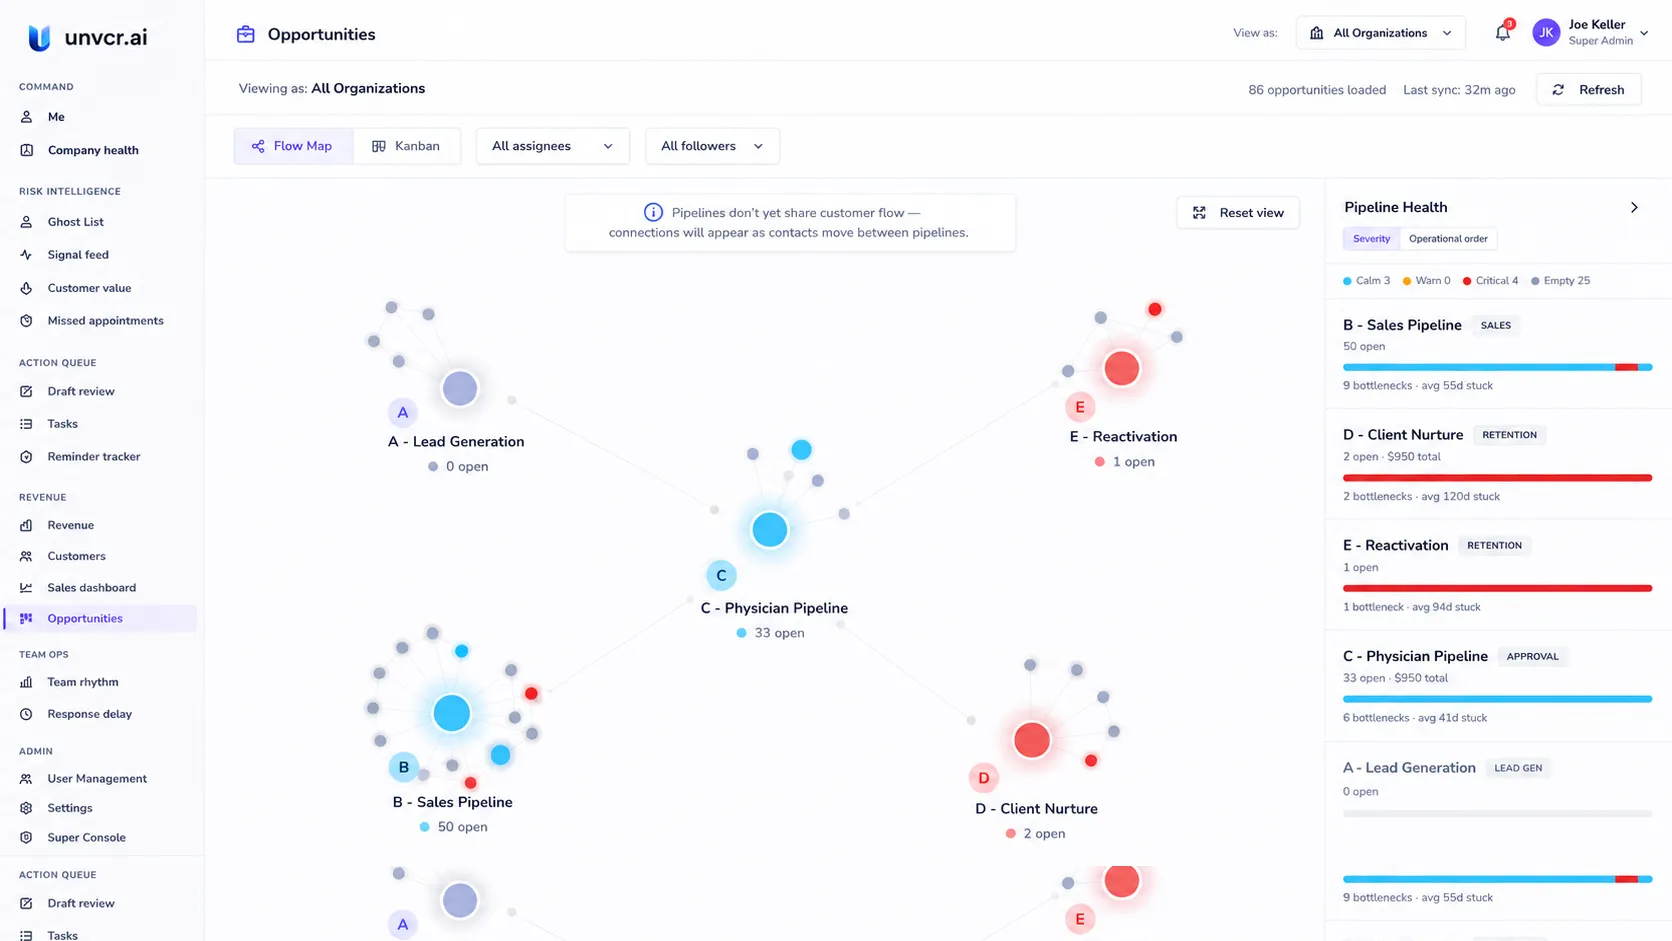
Visualize your pipelines as interactive flow maps, kanban boards, or journey lists. Each pipeline node shows opportunity counts and health status. The Pipeline Health rail scores severity across all pipelines, highlighting bottlenecks and stuck opportunities so you can intervene before deals stall.
Three views: Flow Map, Kanban, Journey list
Interactive pipeline graph with click-to-drill stage detail
Pipeline Health rail with severity and bottleneck counts
Contact health tier badges on every opportunity
Assignee and follower filters with pipeline selector
Coaching, not punishment
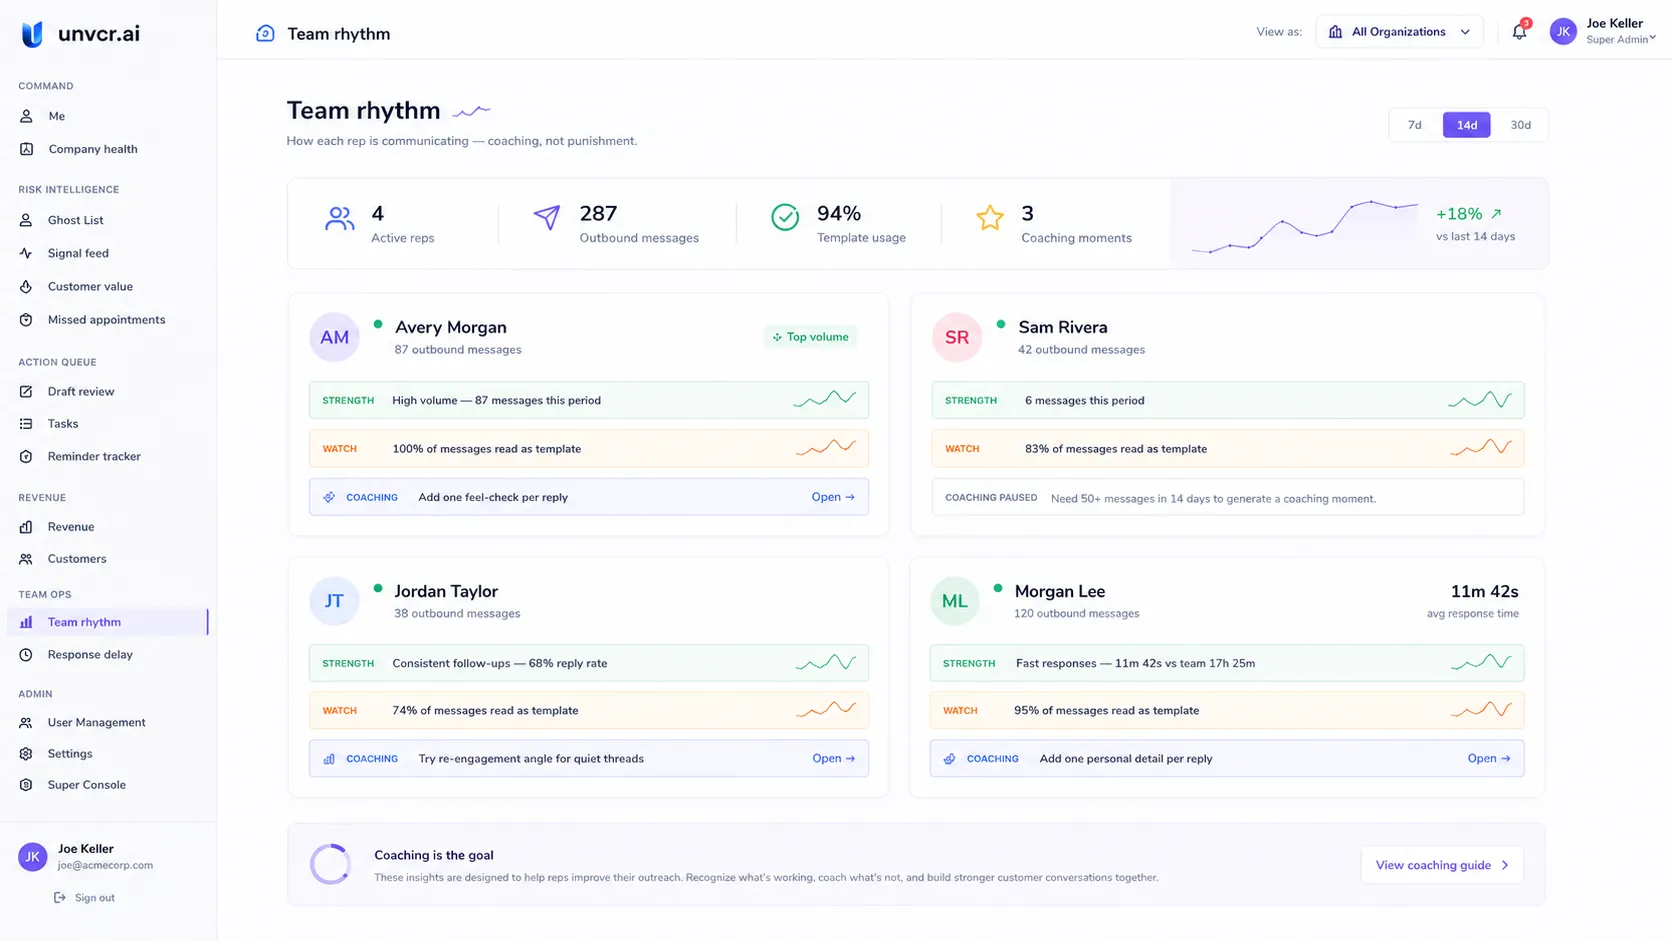
Team Rhythm analyzes communication patterns across your team — messages sent, response times, and template usage. AI generates coaching signals per rep: strengths to recognize, watch items to address, and specific suggestions to try. Response Delay tracks stalled conversations and lets supervisors send reminders directly.
Per-rep cards with outbound volume and response time
AI coaching signals: strengths, watch items, try-this
Weekly coaching moments generated from communication patterns
Team average baseline for comparison
Response Delay with color-coded lag (red > 24h, yellow > 12h)
Ready to see it in action?
Join the waitlist for access to customer and revenue intelligence for your CRM.